Climate
Literacy
Understanding your influence on climate and its influence on you and society.
Adaptation stories
in the Adriatic sea
The solutions, the policies, the people: stories in pictures and words of how, based on science, responses to local vulnerabilities and the impacts of climate change are being developed between the the two coasts of the Adriatic sea.
Adaptation
from A to Z
Definitions and neologisms to understand our changing world
All those terms science uses to describe and make sense of this changing world, explained and visualized through infographics, videos, interviews and other supporting formats. Anything that cannot fit inside a dictionary, can be found here.
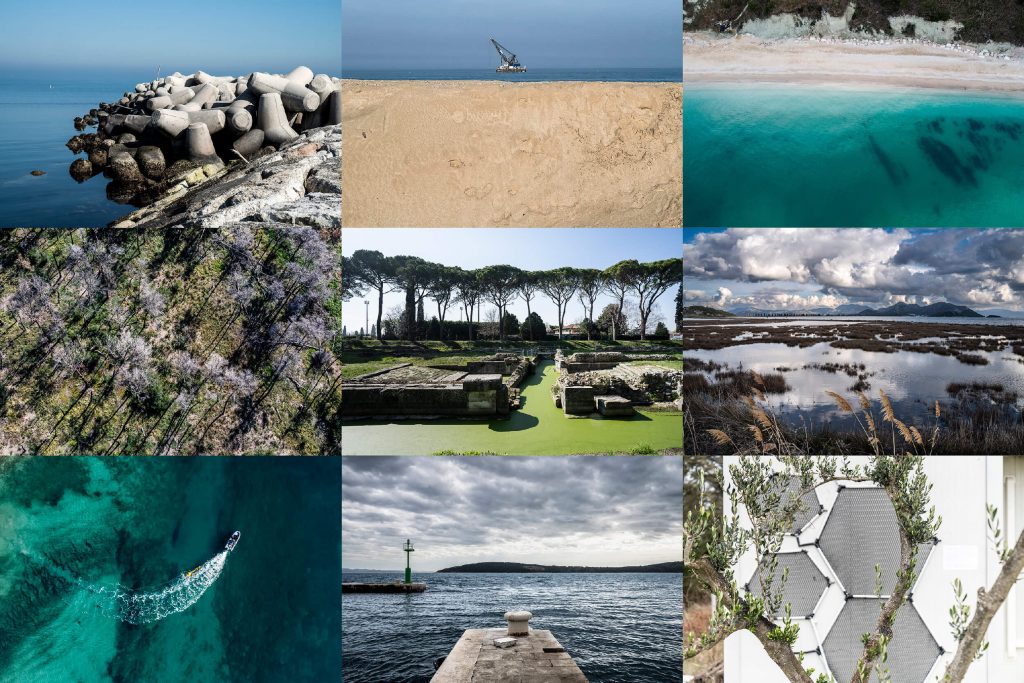
Documenting the change
A visual collection of the emergencies faced and the solutions implemented to document the change and to narrate, without words, the adaptation processes that are taking place on the Italian and Croatian Adriatic coasts.