Easier access to scientific data
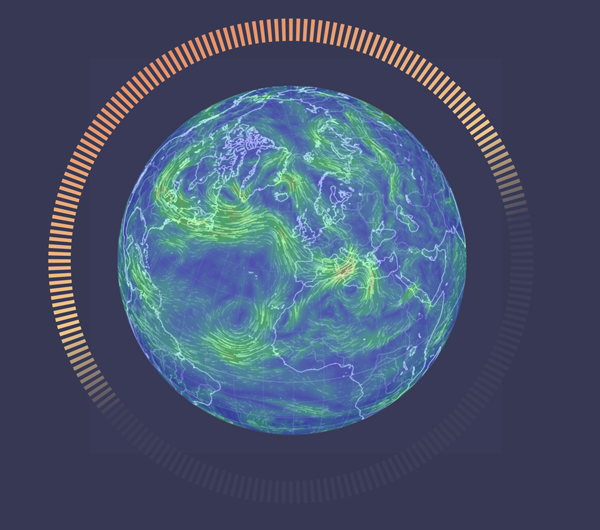
Observing data
Advanced simulations and prediction systems to discover the future climate
Data visualization is the translation of numerical information into a visual context, such as a map or a graph, to make the data easier to understand and draw insights from. The main goal of data visualization is to facilitate the identification of patterns, trends and anomalies in large datasets. The term is often used interchangeably with others, including information graphics, information visualization, and statistical graphics.
Data visualization is one step in the scientific process: after data has been collected, processed, and modeled, it must be visualized in order to draw conclusions.
Data visualization is essential to monitor the results and ensure that the models are working properly.
Data are stored on servers to provide an easy and consistent way to download subsets of scientific data in common file formats and create graphs and maps. For example, oceanographic data collected from satellites and buoys are depicted in the following visualizations. Our goal is to make access to scientific data easier.
Data visualization offers a quick and effective way to communicate information universally using visual information.
The advantages provided by data visualization are many:
- ability to quickly absorb information, improve insights and make faster decisions;
- enhanced ability to maintain audience interest with understandable information;
- easy distribution of information that increases the opportunity to share insights with all stakeholders;
- greater ability to act quickly on results and, therefore, to achieve goals more rapidly and with fewer errors.
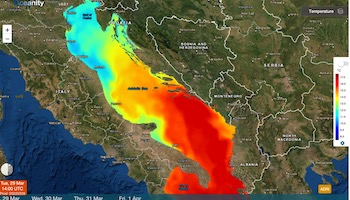
AdriFS
The Adriatic coastal Forecasting System
AdriFS is a numerical ocean prediction system that produces simulations and short-term hydrodynamic and wave forecasts for entire Adriatic Sea, with specific higher resolution in the overall coastal areas. The operational chain is based on a downscaling approach starting from CMEMS – MFS.AdriFS is realized by OPA Division.
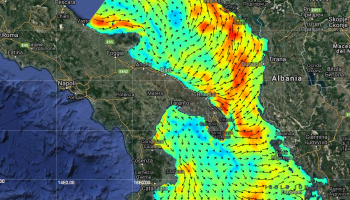
SANIFS
Southern Adriatic Northern Ionian
coastal Forecasting System
SANIFS is a numerical ocean prediction system that produces simulations and short-term hydrodynamic forecasts for Southern Adriatic Northern Ionian Seas, with specific higher resolution in coastal areas and harbors of Apulia region. The operational chain is based on a downscaling approach starting from CMEMS – MFS. SANIFS is realized by OPA Division.
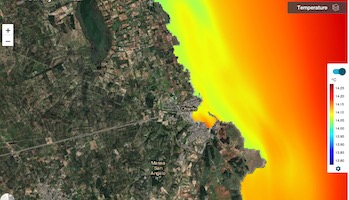
Otranto Coastal Ocean Forecasting System
The Otranto coastal ocean forecasting system is a numerical ocean prediction system that produces simulations and short-term hydrodynamic and wave forecasts for Otranto Strait, with specific higher resolution in the Otranto coastal and harbour areas. The operational chain is based on a downscaling approach starting from CMEMS – MFS. The Otranto coastal ocean forecasting system is realized by OPA Division.